Wealth Buys Independence
Independence Is Wealth
Saving Energy Works, For Each Person
Saving energy is far more profitable than saving money. An investment that perpetually saves energy collects the benefit that energy costs must rise at a pace far greater than general inflation. An ordinary savings interest rate is generally cancelled by the pace of inflation. Even the fortunate who reliably make money with money, will do much better in a one-time purchase, perpetually saving energy they must else buy and expend, for their own personal needs. This is true even if some savings are offset by affording of better health and better productivity, in more-comfortable temperature settings. The saving of energy is the opportunity of every person, not that of an electric power producer or gas utility who has conflicting interests.
An energy utility might simply lose revenue and profit, if able to reduce power production. Independent of demand, a utility might profit from falling energy prices related to reckless production, where evil bargains as in fracking are not shared with users. Demand-Side Management to reduce power production for our homes by a utility might or might not be good business. A utility will miss most of the benefit in energy conservation.
Because of conflicts of interest, the math weighing the sensibility of measures in homes and small businesses must deal solely with the interest of the energy users. Means must be established, that users may achieve energy-saving measures, unrelated to the interest of an electric power producer or gas utility.
All energy demand eliminated forever at bearable present cost is in fact a present fortune.
Mathematical Defense Of Weatherization, Perpetual Returns
The foundation of the needed math is in the notion of a perpetuity, something that will persist without apparent horizon. Where weatherization work is done durably as it must be, to last for sixty years, we have that non-visible horizon. It is wrong to think of durable energy saving investments only through a period where they are repaid by consequent savings. The big actor in the math is the fact that energy costs grow much faster than inflation of the cost of living in general. Durable savings accelerating geometrically, well beyond a period where invested costs are recovered, have very great meaning, in the present.
Download Chapter 3, Stock and Bond Valuation: Annuities and Perpetuities, at this URL:
PV0 = C1/(1+r) + C2/(1+r)2 + C3/(1+r)3 + ... + Ct/(1+r)t
The mathematical expression above describes a general perpetuity. Imagine any setting aside today of money for guaranteed future cash payouts, symbol Ci. A shortcut applies when all cash payouts are equal.
PV0 = C/ r
r is called the discount factor, and includes the interest rate, i for the payout period, that is available to the investor. What of inflation as a factor? ivo-welch does not discuss this. Please find an internet discussion of such investment considerations that does consider inflation, at site Personal Finance & Money Stack Exchange, question What is the equation for an inflation adjusted annuity held in perpetuity? Participants in the discussion see the opportunities involved as real, as in choice what to do if you win a lottery. With tax considerations in much larger sums, some formula for slowed payout will make sense.
Consider annual payouts and inflation, at annual rate g. The adjusted discount factor, r, is:
r = i - g
It will not matter however in calculating present values, whether inflation subtracts from i, or is seen as a multiplier on payouts to keep up with inflation. For a bad investment, keeping money in a bank, one will feel less foolish if actual payout, and the math, have payouts rise to keep up with inflation. For conservation investments, don’t mix general inflation and soaring energy costs in a payout table.
PV0 = ∑ Ci/(1+r)i = ∑ Ci/(1+r)i
Whether Ci grow geometrically with inflation, or r is reduced by g, PV0 values are not distinguishable. This may be demonstrated by trial in Excel.
Background For Inflation Numbers
The pace of general inflation is expressed in the following chart:
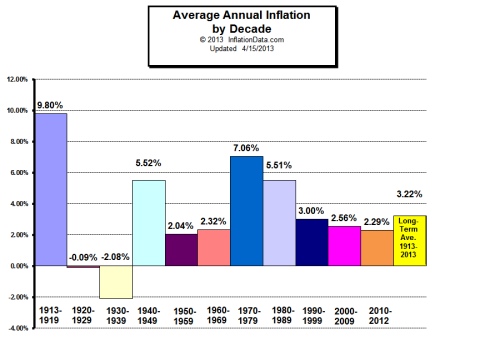
I believe we are in a period of false low inflation as in the 1920s, perhaps again to be followed by deflation in really-hard times, but to be followed further by large inflation. Over a sixty-year view of an investment today, assume at least 3.22% inflation. Know that inflation in wages and simple costs of living must increase sharply in the future, driven by very great inflation in costs of housing and medical care.
Look at Consumer Price Index data that include the greater rate of increase of energy costs, and know that data do not include housing costs. Medical care inflationary cost is presented, with a nearly-linear rise of 340% over thirty years, 11% of 1983 cost, per-year inflation.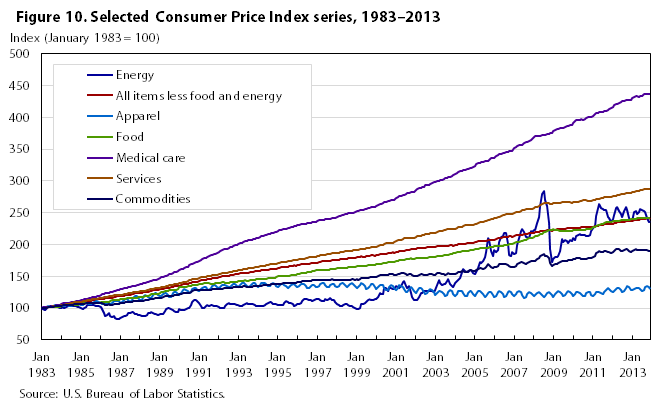
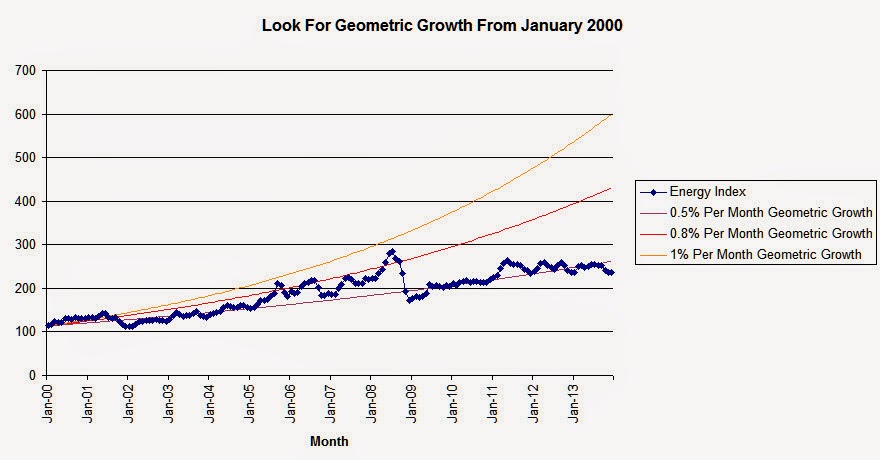
Here is the energy index monthly data, copied to my own Excel file and charted to confirm and assess geometric growth, that a rate of increase multiplier applies to each month’s number.
0.8% per month geometric growth is 10% per year.
Say monthly growth of the EIA Energy Index is 0.8% in general. Where now repressed by ruin of the Earth in fracking that will soon end, expect a correction for several years at a rate far greater than 0.8%. Yet, for now apply math with 0.8% per month energy index growth, 10% per year.
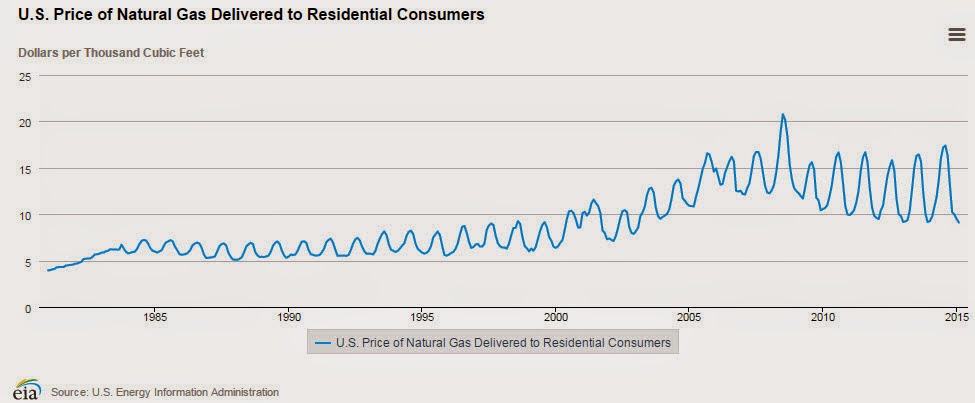
Know that in the short term, gas utilities are profiting from the fracking madness. They do not pass along the low prices they are paying, in savings to consumers. The number $20 Per Thousand Cubic Feet is the $2 per therm I currently apply in payback math for my customers. It has been reached, and we will soon move well beyond that number. Where cost of energy does not include federal expenditure for associated wars, and does not consider unfathomable cost if we could mend the ruin by fracking, real cost to heat our homes with natural gas is far beyond $2 per therm, right now. $5 per therm? $10? Infinity? Surely, through the next sixty years, energy costs must rise much faster than that we have allowed for health care costs.
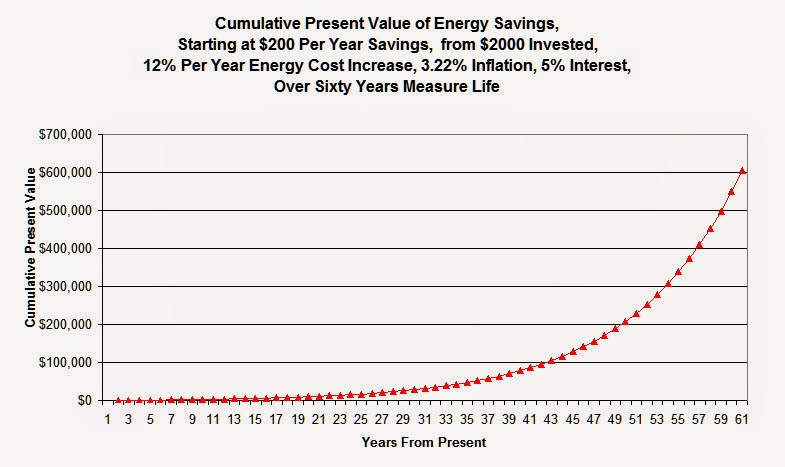
0.8% per month growth of energy prices amounts to 10% per year. For math operations in Excel, apply a 10% per year growth of energy cost. As a test of sensitivity, also do math at 12% per year.
Study Results, Excel Spreadsheets and Charts
Simple Perpetuities For Bank Deposits
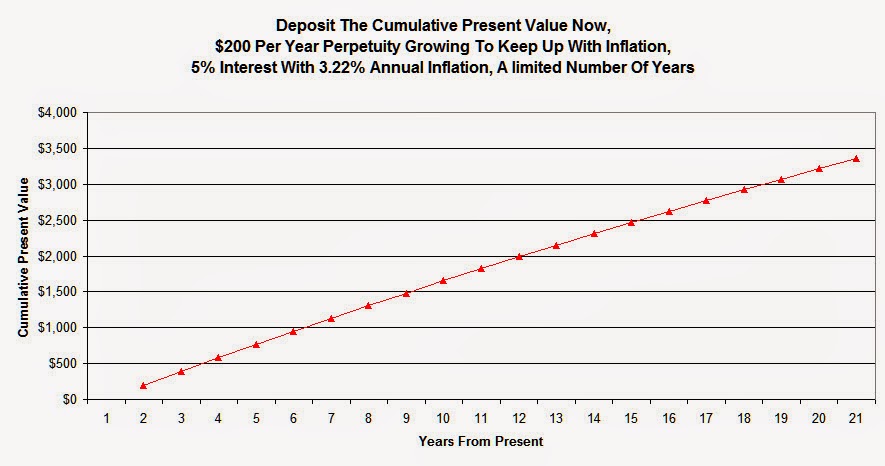
If I locked up money in a bank for annual perpetuity payments starting at $200 and growing to keep up with 3.22% inflation, money at 5% interest, a $2000 deposit would secure eleven years of payments. I think no one would do this.
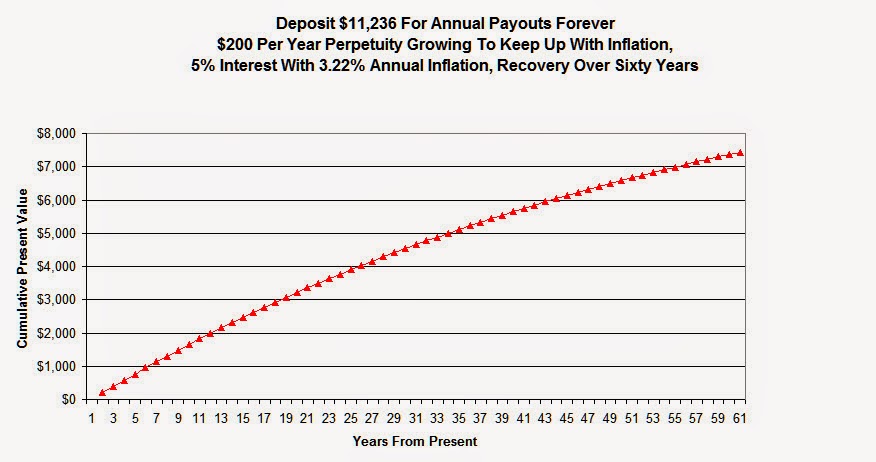
See how money is wasted, if you only keep it in a bank. A deposit of $11,236 is that for which a banker would pay you an annuity starting at $200 at end of the first year, growing in years thereafter to keep up with 3.22% inflation, with the bank offering 5% annual interest on deposits, payable “forever.” Through fifteen years you will recover a present value of only $2624. Money not put assuredly to work, is assuredly lost.
Here is the associated Excel file:
Perpetuities With Energy Conservation
Now see what happens with investment of just $2000 in weatherization measures that produce $200 per year savings at current cost of energy and continuing to save the same amount of energy despite rising energy costs at 10% per year. Here correctly consider 3.22% inflation as a multiplier, 1.0322, upon the annual payouts. The cash in hand each year in lieu of energy purchased is inflation-proof, and inflation must be considered. Consider money at 5% per year interest.
Begin with a short time horizon, just twenty years:
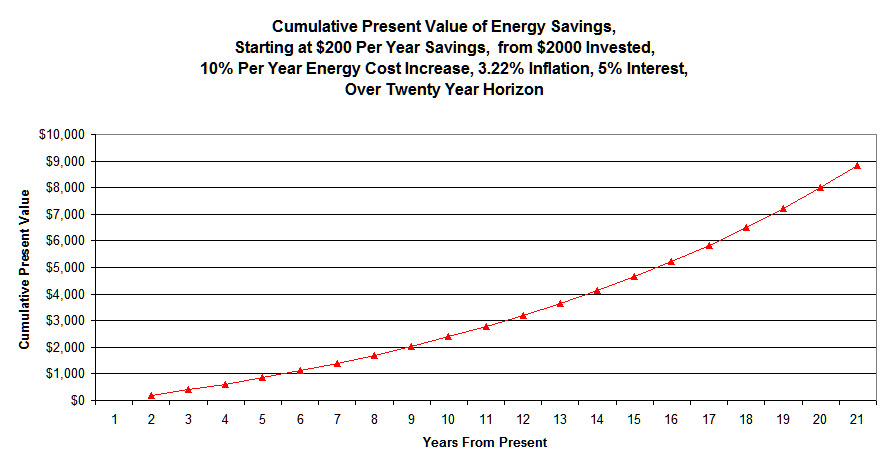
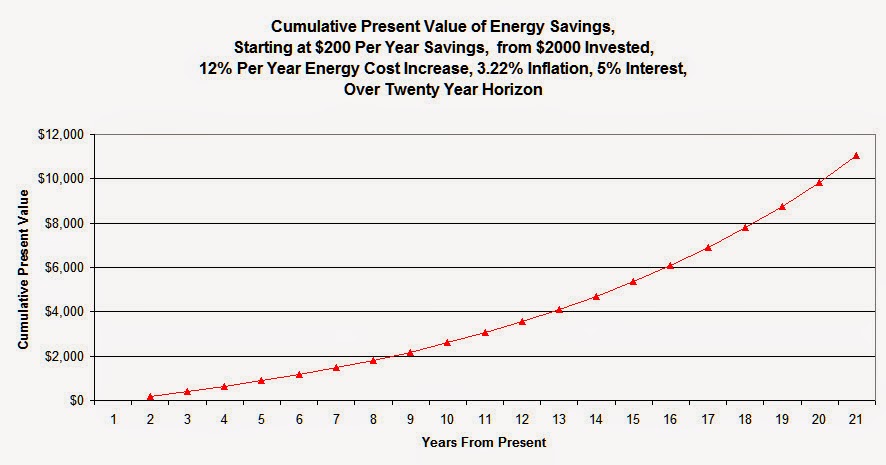
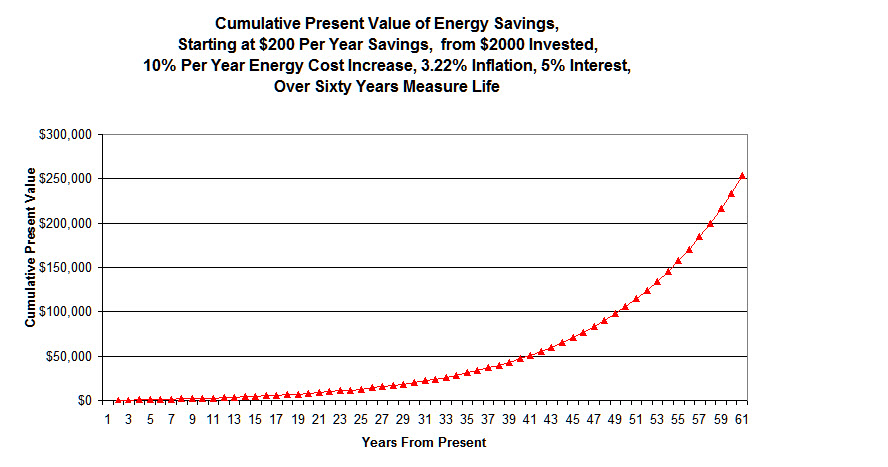
With energy cost growth at 10% per year, the return of a $2000 investment takes just eight years, if savings start out at $200 per year. At fifteen years of savings, the present value of the growing energy savings is $5,230. At twenty years, the present value of the growing energy savings is $8,850. At sixty years outlook, the present value of energy savings, the amount you would have to set aside now to pay for energy not saved, is $253,000. Someone should be willing to pay a lot more than $2000 to secure $200 per year energy savings, even if willing to look out only fifteen years. The more durable the work, clearly to last far more than fifteen years, the more one should be willing to pay. Where I earned $17.50 per hour in an example job with total invoice $4500, $2000 of that for the energy-saving measures netting savings, invoice at $6500 would have netted then-profitable $30.00 per hour. Let a home owner see that access costs enabling energy savings, are justified, and of value more than in making attic space useful.
The job example:
The remarkable returns for energy conservation justify associated non-energy investments. We must name reasons to afford fairer invoice of exceptional work, to sell jobs by, and to entice most-caring and most-intelligent workers, in a hardly-begun national project of existing-homes weatherization. At the same time we must see through math, that thoughtless and shabby work is a very bad investment, not to be tolerated in impairment of energy conservation.
Better payback math helps to find value in work with small returns, too. Say durable work costing $2000 nets only $20 per year savings. Is that a bad investment? No. A times-100 return takes only 29 years horizon of value.
Here are Excel spreadsheets for the two sets of parameters:
Perpetuity Math 10_3.22_5 lists and charts numbers with 10% per year growth of energy cost, 3.22% annual inflation and 5% interest on bank savings.
Perpetuity Math 12_3.22_5 lists and charts numbers with 12% per year growth of energy cost, 3.22% annual inflation and 5% interest on bank savings.
Please query these charts and test cell definitions against your common sense. I will respect all comments and will credit any corrections to their contributor. Or, this task could be passed upward to some responsible authority.
These charts for wise conservation investments apply whatever the period that matters to you, and whatever the efficacy of the measure done. Scale the $200 initial savings to whatever is achieved, as mentioned above. The value in charts is that of showing the geometric growth of any investment in energy conservation.
Here are charts for most-durable weatherization lasting sixty years:
It is easier to use Excel charts and tables that scale from one dollar of savings. The growth out sixty years is the dramatic compounding known to millionaires and billionaires and achieved for them in big publicly-funded solar, wind and electric car energy-independence. It really is for us all.
The savings growth out twenty years is all most of us can imagine, and may be all we can benefit from. Know, this is the heap of gold you would need right now to provide energy out into the future, if the need is not avoided forever, by conservation.
Sixty-year durability of energy conservation measures is afforded always, where promoted for anyone through up-front public financing. Financing shall come from new State Banks, divorced from greedy Wall Street gamblers and thieves too big and soon to be failed. Financing shall cover all work crucial to survival of a home including plumbing, wiring of all kinds, and shell integrity. Problems and opportunities shall never be buried, then demanding a churn and further cost against disturbance of the energy savings. Homes shall be solar-ready, and a lot more.
We should not nit-pick, choosing only low-hanging fruit, only those measures thought to have greatest savings results in any home. Grandma had it right. A penny saved is a penny earned. Every perpetual nickel counts. Public investment will include many expenditures not related to immediate returns, but lastingly to quality of our lives, in durable homes and workplaces. Public investment will hinge more upon sensibility, than upon savings achievable.
And, let us keep count for every person at home and at work. Let it be every for every opportunity, not some rebate-of-the-month. Let every person have strong self interest to keep count in publicly-kept checklists and completion records. Let these records relate to rewards in applied interest rates for borrowing, logical basis for property sales, and taxes due.
Let absolute honesty be achieved through three-party accountability. I imagine much private employment of people I call Diligence Reporters. These reporters are rated and chosen, for skill, efficiency and honesty. This process will largely replace municipal permitting and inspection that must fail, where citizens become unable to pay those inefficient workers in impending harder times. The current municipal process fails too, to promote best quality, durably recorded.
The Workers
Where the great value in energy conservation is accepted and we get on to deal with the 80% of homes and small business properties never weatherized, we will need a very large weatherization workforce, quickly. This workforce must have new means and motives for utter competence and honesty, again publicly and competitively rated. My imagining includes contractor cooperatives taking classrooms in our many abandoned public schools. These contractors and central staff become a community asset, aiding and energizing homeowners as rated workers, sharing building resources. If this will only work in staving off chaos upon collapse of the monster banks, know this is imminent.
An End of Cheap Fossil Energy?
At 4/6/2022, post this Bloomberg News graph of the rapid surge in oil prices attendant to Russia's war against Ukraine. On a longer time scale, this is surely exponential change. Won't that continue? Hasn't this always been so? Scarce resources can not be held cheap.
At 11/22/2024, add to this post upon reading this at NAIMA, Insulation Institute blog:
Nov 22, 2024 1:32:31 PM, Stacy Fitzgerald-Redd
Electricity prices across America continue to increase even as the price of natural gas for electric generation is near an all-time low. Electric utility costs have increased by 24.8 percent in three years. They will continue to escalate until the Federal Electricity Energy Regulatory Commission acts to protect consumers versus the utility companies that build transmission lines.
What is the better, alternative math? Look here.