Look at Consumer Price Index data that include the greater rate of increase of energy costs, and know that data do not include housing costs. Medical care inflationary cost is presented, with a nearly-linear rise of 340% over thirty years, 11% of 1983 cost, per-year inflation.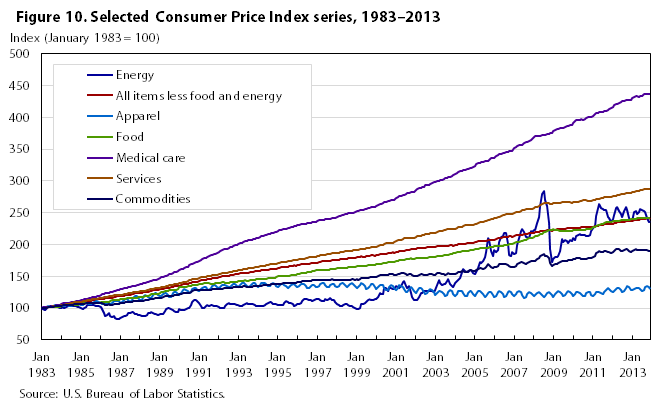
Here is the energy index monthly data, copied to my own Excel file and charted to confirm and assess geometric growth, that a rate of increase multiplier applies to each month’s number.
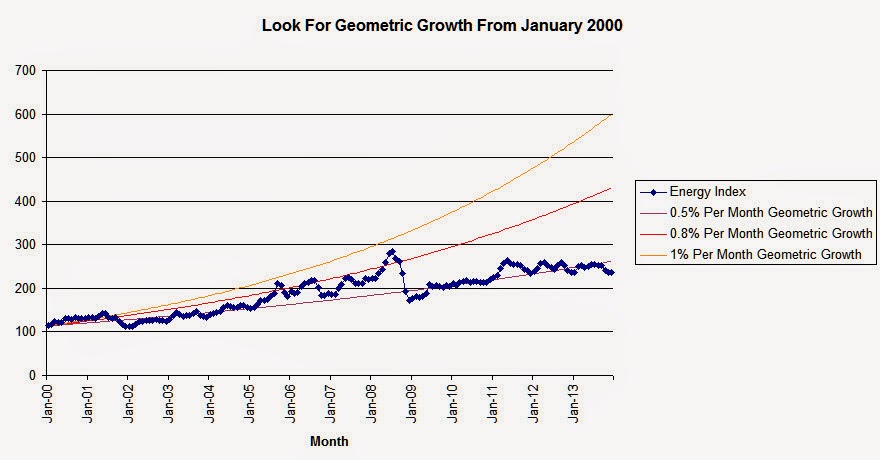
0.8% per month geometric growth is 10% per year.
Say monthly growth of the EIA Energy Index is 0.8% in general. Where now repressed by ruin of the Earth in fracking that will soon end, expect a correction for several years at a rate far greater than 0.8%. Yet, for now apply math with 0.8% per month energy index growth, 10% per year.
END OF TRANSFER FROM PRIOR POST
But, who am I to think I can foresee anything? Would we have more trust in views of the US Department of Energy? Consider the following Footnote 3 from US DOE analysis supporting their proposal on Lighting for 2018 IECC:

IECC calculations are based on year-by-year fuel price ratios derived from price estimates published by EIA (Annual Energy Outlook 2015, table accessed 2 Dec 2015 from http://www.eia.gov/beta/aeo/#/?id=3-AEO2015&cases=ref2015 ; 2013$ price estimates converted to ratios relative to 2018); the effective rates shown in the table are the uniform annual escalation rates that would give the same present value of energy as the estimated year-by-year price ratios.

This is a strange imagining of the future, where consumer natural gas prices will never even reach $2 per therm. Through 2040, natural gas prices will rise at only 1.74% per year, or about half the pace of general inflation, which I take to be 3.22%.
EIA warns that this chart is Beta, and I have offered corrective feedback. Looking further at the EIA web site, I find more-believable projections:

5% per year is it, vs. 10%? Or, do Henry Hub prices not relate to consumer prices? Of course, the larger growth, and more, is passed on to consumers. And, know, US government positions do not oppose destruction of Earth with any available means to sell off energy anywhere, for further enrichment of the extreme-wealthy. The wealth of knowledge of all people might intervene. A chaotic jump to more than 10% annual growth of fossil fuel costs will follow the imminent end of fracking. The rise will follow a bottoming of commodity prices as we move into the Great Depression Of 2016, caused by derivatives crime on Wall Street, and blamed on a convenient catastrophe. One hundred evil families behind this think then, that they will have it all. Those who have created some energy independence, will have an edge in survival and guiding of a better future. Let us not be misguided in planning now for that future. Energy independence in lighting is an early bud of that future. Let's nurture that bud.

Here is a new look at the Energy Information Agency Data from 1983 to 2013. My Excel file is here. See that growth rates change with world events, with persistent depletion of fossil fuels, and with huge cost impacts already, of environmental ruin. Energy prices tumble with other commodity value where we fearfully fall into a recession (2001, 2008, 2012). Growth rates in recoveries are increasingly steep, where we face up to depleted resources. Recovery cycles are ever-shorter, last time only three years beyond 2009 rescue of derivatives gamblers in the printing and hand-over of hardly-imaginable 13 or 16 trillion dollars . That unimaginable bailout is nothing compared to further ballooning of derivatives exposure, now over 280 trillion dollars , and beyond any hope of repair. Perhaps we have run out of time to prepare for what is coming, but we must at least foresee paths to survival.
I accused that projecting growth of an energy index dependent upon natural gas energy, at under 3% per year through 2040, is not a silly error. It is another tweak of the peak, before the fall, fully intended by a complicit US Government.
Please see a TED-Ed review .