Translate

Showing posts with label Energy Usage Histories. Show all posts

Wednesday, April 12, 2023

Energy Cost Tracking Through Decades of Actual-Cost Data, Charted in Microsoft Excel, Two Example Homes

This post is a further challenge of home energy-efficiency rating as a home owner asset for real estate purposes.  Why shouldn't we just rely on actual operating costs as measure of home energy efficiency?  (Google that, and the question is not recognized. Far down the results, a UK EPC, Energy Performance Certificate  is discussed; and no, it is not on-topic.) 

For any home, there is no better measure of energy efficiency than actual utility-cost data. That data will have complexity. Whatever, it will be more real and inspiring than transitory numbers of some rating scorecard. Every improvement or degradation nullifies a score; cost data is perpetual.

Where cost-tracking is continuous, it becomes useful for verifying effects of a continuous process of home improvement and varied usage. Is a new appliance working correctly and as-claimed? What costs are seasonal, or dependent on the number of house occupants? A home energy score is if anything, a drag upon making changes.

Here is a display of monthly data of natural gas usage in my now-a-rental home, for the past eighteen years:


Annual totals for July through June heating seasons are more informative. 


See that through 2012 with the house unimproved and kept chilly in Winter, I tolerated annual cost of about $460. Improvements from 2012 to 2016 reduced the natural gas cost by half, still with Winter thermostat setting of 55°F. From 2019, the house has been a rental with an average of two occupants and comfortable thermostat setting, with return to annual cost of about $460. See that extreme economy is met with increased importance of base charges, and bills are reduced less than expected. Results with careful weatherization are unambiguous, when accomplished scattered over time. A very big further improvement is still needed: replacement of the like-new high-efficiency gas furnace with a heat pump unit. As with everything else I have done, this will happen with study, with work done and documented by-myself except the final commissioning. I hope to find a good  Heat Pump Coach , as advocated in today's email feed of Onward Oregon . I hope I will be favored with early access in this, for my role as a reporter. I aim to be a good reporter in the similar matter of Heat Pump Water Heater evolution, where I have coped with an early-technology failure. I learn by doing my own work, but must not fail to benefit from a depth of experience.

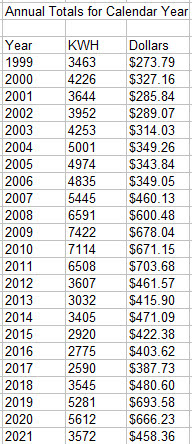
Now look at to-date electricity usage:

Large consequence of a  heat pump water heater failure is evident in  tracking of electricity consumption in my now-rental home. Large electricity savings with  a 40 gallon Rheem Professional Prestige ProTerra Hybrid Electric Water Heater PROPH65 T2 RH375-SO, were wonderful, for one year. I have detailed the factory-offered repair in replacement of the control board, which did no lasting good.   Electricity usage rose to a brief historic high at year-end 2022. At last the 40 gallon Rheem HPWH was scrapped.


Such an undignified end for my "exceptional" first-try HPWH. Nothing in the nearly-new unit was of interest for salvage. Rheem provided a replacement at no cost except that of increasing size from 40 gallons, to 50 gallons. Perhaps renters used exceptional amounts of hot water, that forced generation with resistance heaters. A bump-up in size might not help, but give it a try.


House in transition, it will take several months to know that weird electricity consumption is at an end, with this brand-new 50 gallon Rheem heat pump water heater.

PRO H50 T2 RH310UM
SN 0322208450

Wall Pads; that's what I'll call the four wood assemblies that, with ropes, secure the position of the tank in the event of an earthquake. The 40 gallon tank was 20.25" OD. This is 22.25" OD. To accommodate the change, I reshaped the painted-white 2x4s, and moved each pad assembly an inch away from the walls corner. I am serious in belittling the steel straps sold for this. What, really, do they anchor to? The 3/4" plywood at the wall is anchored to the wall studs by 3" deck screws. How could steel strap-ends conveniently align with wall studs? Earthquake loads are lateral, for sure splitting the  studs at bending lag screws. Here with diagonal 1x8 shiplap behind 5/8" drywall and very many pad screws, this tank is anchored.

Isn't this an exceptional installation?


At April 2024, note new professional acclaim of this Rheem model, by highly-followed YouTube creator Matt Ferrell: https://www.youtube.com/watch?v=abGiNL9IT54


See that with vent and drain plumbing behind the wall, in the now-conditioned crawl space, it was easy to create a new P-trapped drain for HVAC. The little Tygon tube for high-efficiency gas furnace condensate, no longer dangles across steps to a utility sink. The convenient dedicated drain will accommodate more drainage from heat pump HVAC.

With the new 50 gallon HPWH, in time, I expect to see lasting return to annual electricity cost of about $500 per year. Judging that electricity consumption is not seasonal, prefer annual totals for calendar years. 


Conclude that with two-person occupancy as a rental, my well-documented energy-efficient home has annual natural gas cost of about $470 per year. The total electricity cost is also  about $470 per year. Elimination of natural gas service would reduce natural gas cost by about $200 per year, and increase electricity cost by about $100 per year. The home draws about 4000 KWH per year, ahead of a conversion to heat pump HVAC.

Can I know how my house measures up to standards? A resource of interest to me in learning tried better methods of house construction - - is Portland, Oregon 501 (c)(3), Earth Advantage . I look to them now.

Compare energy efficiency of my well-improved 1000 sf house, to that of a 832 sf super-well-built single-story ADU built in Portland in 2020. Consult this training video , at time 9:31:

$45 per month energy cost, per-year, scaled to 1000 sf: $649 per year. Presume that the EPS-label energy cost is the sum of electricity and natural gas costs.  For my house that sum is a bit less than $1000.

I hope that Earth Advantage collects and studies actual-cost data, now two years of it here. A score that has physical meaning, is interesting.


My house has room for doable improvement, probably by less than $200 per year. Compared to neighboring homes, mine surely is very efficient.


Actual Decades-Long Cost Data for Another Home, Where I Improved the Attics

A two-story Ranch home in Sandy, Oregon:
Now begin charting for another home with extensive energy usage data, that of my older sister, whose house has also been improved by my weatherization.  I look for proof that my work produced savings, and seek to learn more about what constitutes good record-keeping, and charting in MIcrosoft 
Excel.


This is a two-story home well-built in 1973, 2052 sf conditioned space. Heating is also natural gas, with no air conditioning. Expect natural gas cost to be more than double that of my 1000 sf single-story home, with nearly-same electricity cost.


This home and its natural gas usage history were described in a previous post, October 23, 2012, Making Sense of Gas Usage History . There see detail of very-substantial attic floor sealing and added insulation.

An additional decade of data is interesting. Was the Winter of 2020 exceptionally cold; or staying warmer and healthy in the epidemic? This home used more than twice as much natural gas than mine, from the same supplier, Northwest Natural, and at reduced dollars per therm. There were years before the weatherization where fewer therms were used. Were they exceptionally mild? What happened in 1997? Whatever the complexities, I think the charting is a rewarding exercise. We're doing good things. What will we see if now there is conversion to heat pump HVAC? History matters.


See annual natural gas usage of about 1200 therms, $1000, as expected.


See electricity usage well-tamed by LED lighting and technology improvement in appliances and connectedness to information, costs steadily declining, while approaching a doubling of electricity rates.


The annual electricity cost is nearly double that of my 1000 sf single-story home. That's a bit surprising.

See consistent Excel charting with some different trial of logic for colors.

Friday, October 29, 2021

Electricity Savings With A Heat Pump Water Heater

I am eager to share proof of projected 40% electricity savings, in replacement of an ordinary resistance electric water heater, with a beautiful heat pump water heater, HPWH. The installation was reported in post an exemplary heat pump water heater.


I have the unusual resource of a chart going back 22 years. This chart through December 2021  includes a full year since the water heater replacement. Savings are very evident, seeming to be the expected 40%:


From 2012 to 2018, there was remarkably little need of electricity, me living alone. Demand might have been met with a modest photovoltaic array but for neighboring trees to South, and adverse West facing of the major roof surface. For the past four years, occupancy and electricity demand have doubled, with two wonderful renters in this 1955 home now fully weatherized and modern, radon-free. It is a rare rental opportunity, managed with some originality. All utility costs are auto-paid by me. The renters pay a fixed total of $200 per month for electricity, natural gas, water/ sewer and trash/ recycling, balanced annually against actual payments. Where I see the costs and share pain, I am moved to do all possible to reduce costs; thus the HPWH.

I believe charts showing control of somewhat-voluntary expenses, can be rewarding and inspiring. And, yes, they can be dispiriting if not achieved. We wonder why monthly utility bills include charts such as this of the October 2021 electricity bill:


There are many variables of weather, behavior and occupancy, in monthly bars. Why a December spike? Visitors? October comparisons pre- and post-HPWH 278 kwh vs 390 kwh, a drop of 29%, is as expected, but probably under-states actual savings accumulated. Is that really 40%, as hoped?  Sometimes the trends in this bar charting, are concrete.

From my Excel file:


See annual savings of about : ($680 - $460.)  $220, a 32% reduction of annual total dollars. With $220 per year savings, $18 per month on average, the material total cost of $577 (plus my free labor) is repaid in fhree years. If the water heater serves twenty years, the present value of the annual savings, applying my Perpetuity Math, is $24,000. What a good deal!

In January 2022, find the deal quite diminished for a new investor. My $399 purchase in November 2020 was of: Rheem Professional Prestige ProTerra Hybrid Electric Water Heater PROPH65 T2 RH375-SO
Offered today at homedepot,com, $1199 after $500 discount:
 Local distributor General Pacific offers this unit is $1658 minus $500 = $1158, not a compellingly better deal. Equivalent models from Rheem and from AO Smith, cost the same,

Energy Trust of Oregon in its public web site doesn't bother to promote the heat pump water heaters it subsidizes with public funds, while subsidizing flimsy LED light bulbs with far less savings potential, I think the HPWH promotion is very muddled and.is probably not working, The better bargain two years ago was a missed opportunity too, I suppose. We should be moving these by hundreds of thousands, involving DIY home owners as well as contractor allies of Energy Trust..Maybe slow motion is a factor in ballooning  cost.

Failed promotion of heat pump water heaters is a big disappointment to me as an advocate of affordable rental living (my house as exemplary). I am so happy for what I have done. Who else even thinks of this?

Here post updates of the monthly electricity usage tracking, ever more clearly the dramatic savings with the HPWH. Hot water is much more nearly "free", not proportional to the number of house residents, perhaps more free than with some rooftop solar collector, that would be badly oriented, shaded by a neighboring tall Douglas Fir. 

For a house that could "go solar", a heat pump water heater must be key in being solar-ready.


Thursday, March 26, 2020

My Trial of Pacific Power Blue Sky Renewable Energy

In October, 2018, I signed up with a solicitor at my door, for Blue Sky Usage , to: 
Support 100% Pacific Northwest renewable resources from Oregon, Washington and Idaho. The resource mix is likely to include wind (87%), biomass (2%), solar (10%) and geothermal (1%).

The cost is about $8 more per month, (for typical customer),   $0.0105 per kWh.

Blue Sky is a program of PacifiCorp., Pacific Power, of Portland, Oregon 

It was a very questionable thing to do, where I was within weeks of turning over the house to renters.

Over a 14 month period then, my renters reimbursed to me, these added costs paid:


At 3/26/2020, I reverse the cost to my renters, deducting from my record  of the landlord-paid Utiliies, the amount $65.59. Annually there is a settlement vs. estimated $200 per month added to the rent payment. My Blue Sky experiment never really touched the renters. I do advise my renters of this explanatory post. I don't trouble them to weigh in on virtue of the experiment. 

Where in this review I also summarize household contribution to Oregon's Public Purpose Fund , I treat both as involuntary carbon taxes . Please be patient here with the hyperlinks, and go there to my deeper writing on subjects if you can. I believe in carbon taxes broadly-defined, that energize public banking and that fund all infrastructure development including durable, most-efficient housing-as-a human-right. We must stop believing lies of the greedy most-affluent, that we are better off when self-interested-at-the-top investors are the printers of money, and design projects for their short-term gain. Those of us with assets on Wall Street, and I am not one of them, will see how their ride from the coat tails of the evil Ponzi schemers of an insane market, ends up.

Lumping the two carbon taxes and knowing that the Public Purpose Charge, PPC, is 3% added to a bill, the Blue Sky Charge would similarly be computed as 8.2% of bill. An electricity carbon tax of more than 11% is quite large and yet is acceptable to more than 125,000 participants. I wonder why any of this should be acceptable to renters, where there is no scheme to produce personal benefits for them. If charges are stinky to renters-unaware, they must be stinky for anyone. Yes, the PPC is stinky too. Program managers and Oregon political leaders must know that PPC collections with no possible return to renters and unaware, is theft.

Electricity Energy Conservation Improvements Charted for 22 Years  
(Including 14 months with Blue Sky):  

I have done very much to make my home-now-rental, energy-efficient, Electricity usage with a single occupant was reduced by half circa 2011, in replacing an electric clothes dryer with natural gas, getting rid of CRT displays, and full conversion to most-efficient LED downlights. Electricity usage is proportional to the number of adult occupants. Rising electricity billing rates act counter to the energy conservation. See that in the current winter, my renters used less electricity than the year before, yet bills went up. That change, not warned and not accepted, troubles me very much.


At May 17, 2020, apologize this so far is not instructive to my rental-home electric power utility, Pacific Power. I am bitter in knowing that a phone responder taking my Blue Sky cancellation admitted without apology, that Pacific Power finds added solar capacity is uneconomic. My cancellation then is with a vengeance. What is the good in investor profit from investment in some Montana wind turbine? I wasn't doing any good in promotion of solar capacity for my community, with lowered rates that might justify my renters making the Blue Sky contribution.

I recently was hit-upon in email by Pacific Power to make charitable contributions, perhaps a parallel of the Blue Sky deal. I replied with link to this post, unhappy. I said that charity is limited and must be done smartly. (This doesn't measure up.)


LENDING A HAND

To help struggling families and seniors, we will contribute $2 for every $1 donated by our customers to Oregon Energy Fund, making your donation go even further. We’ve already contributed to Oregon Energy Fund and together we can do more.

If you are able, please consider helping those in need of energy assistance by donating.

Today I find on-topic, this current post at RMI Blog:

Says the concluding paragraph of the report of closing a coal power plant in North Dakota:

Cooperatively owned coal across the region, and the country, will continue to come up against the same economic shortfalls experienced by GRE, yet the member-centric, independent co-op business model remains uniquely positioned to lead rural communities through the transition. GRE has set the stage and shown that even in the midst of economic crisis, co-ops can take decisive action on behalf of their members and can lead the way toward a lower-cost, clean energy future.

Try to find out how this might work for investments by caring individuals. Google this statement: Minnesota: invest in cooperative power companies solar capacity 

From this, and many other resources, Pacific Power might find an honest way to let its customers invest with them in the common good of the imperative clean energy future.


Please consider here, this writing by Sightline Institute:

How Utilities Make Monopoly Money


20Institute&utm_medium=web-email&utm_campaign=Sightline%20News%20Selections


See that Articles of Sightline Institute are now linked among Web Referrals of this blog.


At 5/14/2021, add new Label Carbon Taxes to this post upon finding a similar, larger ask of my natural gas utility, Northwest Natural Smart Energy. Whereas Pacific Power wants added revenue beneficial to its marketing that is 8.2% of a billing amount, Northwest Natural wants 10.486%. Both of these takes volunteered by pollution-conscious customers are something of a voluntary carbon tax in Oregon on top of our involuntary 3% Public Purpose Fund energy-consumption tax. The appeal to me arrived in a letter yesterday, and if accepted would be paid by the renters of my home. Where my renters would have no benefit, I think this fails a smell test. I would not ask for their generosity and could not impose a decision upon them.

I call these voluntary consumption taxes  something of a voluntary carbon tax  because the revenue is collected 100% by the generators of CO2, and not by an unselfish government entity. I won't see the take by utilities as unselfish. For anyone, for all of us, reduced energy consumption is profitable. A utility does not need to take money from me, or my renters, to enable investment in less-costly energy extraction or power production. If methane from waste costs more to a utility than fracked gas, the difference should be offset by a utility-paid carbon tax.

Sunday, September 24, 2017

My Energy Use Histories As Carbon Impact

I will continue to update my energy usage histories, to see that major accomplishments in 2012, are sustained. This time follow through to track my carbon footprint, then needing to further process data to get annual totals. Here is monthly data now through September 2018. My savings are sustained, both in natural gas and in electricity consumption. In the case of natural gas for heating and clothes drying, I clearly have reduced consumption by half. This is entirely the result of weatherization improvements, and was easily done with simple diligence in sealing and placement of added insulation.


How does my home weatherization measure up in "carbon" significance, for natural gas heating and clothes drying. ? Here is a chart for natural gas usage, totals through September 2018 tracking, for years ending June 30th:


Annual totals are a better display of weatherization achievements. Reduction of natural gas usage by more than half is evident, and is sustained. Say my current annual usage of natural gas is 140 therms.

There are 0.00548 metric tonnes of CO2 per 1 therm of natural gas . (Source: U.S. Department of Energy)

Multiply therms by 0.00548, to compute tons, result now about 0.8 tons, and about double that before 2012. I reduce my carbon footprint by less than 10% in conserving natural gas heat, but it does matter, and is painless.

US avg.: In 2014, 67.2 million households used natural gas. Collectively, they used 5.1 billion cubic feet of natural gas annually, or 730.84 CCF (approximately 748.38 therms) per household or 283.27 CCF (approximately 290.07 therms) per person per household using natural gas. (Source: Energy Information Agency, US Census Bureau.)

My 300 therms per year, reduced by half, is consistent with these census numbers.

Look too at my electricity usage updated to end-September 2018, for "carbon" significance.


It seems that $30 per month at peak each year is what I expect to pay for electricity, based on long history. I regained control of my expenses in 2012, now at $30 per month average, after doubling of the cost of electricity. It is good that there is not cheap hydro power for us along the lower Columbia River, after all.

The simpler picture in yearly totals has its own story to tell, that 2012 conservation, persists. If current electricity consumption is 3000 KWH per year, that converts to carbon equivalent at 1.5 lb CO2 per KWH, 3000 KWH is 4500 pounds, 2.25 tons. This is nearly three times my footprint for natural gas for room heat and that thrown away in clothes drying. This is not welcome news. I want more justified pride in weatherization than in getting rid of an electric clothes dryer and eliminating all incandescent lighting. I am saving about $300 per year of natural gas, and $300 per year of electricity, by my responsible behavior, but the electricity conservation matters much more as carbon and impact on the Earth. These insights are not intuitive. Are you glad that I have shared them? Will someone please learn things with me, and talk with me via post comments? Or if errors are evident, please offer correction.

If anyone has the means, please join me or lead, in asking electric utilities to save and offer the simple set of monthly data to each customer, retaining without limit as history:
Reading date, Delta KWH, Billing Amount, Elapsed Days, Year (of years ending June 30th.) 

Where billing data unavoidably reveals utility disincentives to save, with large base rates that distort inferred cents per KWH and dollars per therm, I see no justification or benefit in concealment.

Friday, May 6, 2016

My Up-To-Date Energy Usage Histories

This is a recurring update of my post More Tracking Of Electricity Usage , dated 11/19/2014, and now including discussion of natural gas usage, and of carbon impact of both electricity and natural gas consumption. What I really want, and a purpose of this post, is to inspire utility companies to offer better, routine, reports to inspire customers.

Data is from my own home, and is intended first, to show utilities that better feedback to customers can inspire energy conservation. A longest-possible timeline is needed to see and understand usage change. My usage changed dramatically at end of 2011, where I replaced an electric clothes dryer with a natural gas appliance, and continued to reduce electricity usage: with upgrade of all lights to LED downlights, with elimination of CRT computer displays and with move-out of a boarder. It is nice to see confirmation of all of this sudden economy.


The charting of electricity usage including billed amounts adds important information my utility might not wish me to see, that with base charges, my economy is not fully rewarded. The bill will stay above $20 per month, whatever my usage. It is right that I should know this, and that I might then question too-high base charges.


I find no inspiration in the historical usage bar chart contained in my April, 2016 monthly billing.


My natural gas usage also changed dramatically in 2012:


The big decline is despite new demand for the gas clothes dryer. It is not a result of lifestyle change. I have always been thrifty, leaving the thermostat at 55°F or less except briefly bumping up as easiest way of avoiding condensation in the bathroom while showering.

Whether or not I could be an example to others, my charts with visible and persisting change, are what a utility might wish for its customers. Let all utilities offer longest-term charting to its customers, upon request. Requests might be routine at onset of home upgrades with weatherization. Let there be annual followups, utility-volunteered, for such requests.

At 9/18/2017, look further at my natural gas usage as a component of my carbon footprint. I think to do this upon self-assessment , at site conservation.org , not asking much of me, and rating me at 22 tons CO2 emission per year. I last considered my carbon footprint in a blog post dated October 29, 2009, adding it up to about 20,000 pounds, 10 tons, using a now-censored EPA Emissions Calculator .
I am not at 20 tons. This calculator does not inspire energy conservation. Sorry, new friend retired engineer, who brought this to my attention. 

We need a renewed inspiring calculator. We need an end to hijacking of EPA by polluters/ monsters.


How does my home weatherization measure up in "carbon" significance? Look at annual totals of energy consumption in my home. Here is a current chart for natural gas usage:


Annual totals are a better display of weatherization achievements. Reduction of natural gas usage by more than half is evident, and is sustained. Say my current annual usage of natural gas is 140 therms.

There are 0.00548 metric tonnes of CO2 per 1 therm of natural gas . (Source: U.S. Department of Energy)

Multiply therms by 0.00548, to compute tons, result now about 0.8 tons, and about double that before 2012. I reduce my carbon footprint by less than 10% in conserving natural gas heat, but it does matter, and is painless.

US avg.: In 2014, 67.2 million households used natural gas. Collectively, they used 5.1 billion cubic feet of natural gas annually, or 730.84 CCF (approximately 748.38 therms) per household or 283.27 CCF (approximately 290.07 therms) per person per household using natural gas. (Source: Energy Information Agency, US Census Bureau.)

My 300 therms per year, reduced by half, is consistent with these census numbers.

Look too at my electricity usage totals for years ending June 30th, for "carbon" significance.


It seems that $30 per month at peak each year is what I expect to pay for electricity, based on long history. I regained control of my expenses in 2012, now at $30 per month average, after doubling of the cost of electricity. There is not cheap hydro power for us along the Columbia River, after all.

The simpler picture in yearly totals has its own story to tell, that 2012 conservation, persists. If current electricity consumption is 3000 KWH per year, that converts to carbon equivalent at 1.5 lb CO2 per KWH, 3000 KWH is 4500 pounds, 2.25 tons. This is nearly three times my footprint for natural gas for room heat and that thrown away in clothes drying. This is not welcome news. I want more justified pride in weatherization than in getting rid of an electric clothes dryer and eliminating all incandescent lighting. I am saving about $300 per year of natural gas, and $300 per year of electricity, by my responsible behavior, but the electricity conservation matters much more. These insights are not intuitive. Are you glad that I have shared them? Will someone please learn things with me, and talk with me via post comments?