This post is a further challenge of home energy-efficiency rating as a home owner asset for real estate purposes. Why shouldn't we just rely on actual operating costs as measure of home energy efficiency? (Google that, and the question is not recognized. Far down the results, a UK EPC, Energy Performance Certificate is discussed; and no, it is not on-topic.)
For any home, there is no better measure of energy efficiency than actual utility-cost data. That data will have complexity. Whatever, it will be more real and inspiring than transitory numbers of some rating scorecard. Every improvement or degradation nullifies a score; cost data is perpetual.
Where cost-tracking is continuous, it becomes useful for verifying effects of a continuous process of home improvement and varied usage. Is a new appliance working correctly and as-claimed? What costs are seasonal, or dependent on the number of house occupants? A home energy score is if anything, a drag upon making changes.
Here is a display of monthly data of natural gas usage in my now-a-rental home, for the past eighteen years:
Annual totals for July through June heating seasons are more informative.
See that through 2012 with the house unimproved and kept chilly in Winter, I tolerated annual cost of about $460. Improvements from 2012 to 2016 reduced the natural gas cost by half, still with Winter thermostat setting of 55°F. From 2019, the house has been a rental with an average of two occupants and comfortable thermostat setting, with return to annual cost of about $460. See that extreme economy is met with increased importance of base charges, and bills are reduced less than expected. Results with careful weatherization are unambiguous, when accomplished scattered over time. A very big further improvement is still needed: replacement of the like-new high-efficiency gas furnace with a heat pump unit. As with everything else I have done, this will happen with study, with work done and documented by-myself except the final commissioning. I hope to find a good Heat Pump Coach , as advocated in today's email feed of Onward Oregon . I hope I will be favored with early access in this, for my role as a reporter. I aim to be a good reporter in the similar matter of Heat Pump Water Heater evolution, where I have coped with an early-technology failure. I learn by doing my own work, but must not fail to benefit from a depth of experience.
Now look at to-date electricity usage:
Large consequence of a heat pump water heater failure is evident in tracking of electricity consumption in my now-rental home. Large electricity savings with a 40 gallon Rheem Professional Prestige ProTerra Hybrid Electric Water Heater PROPH65 T2 RH375-SO, were wonderful, for one year. I have detailed the factory-offered repair in replacement of the control board, which did no lasting good. Electricity usage rose to a brief historic high at year-end 2022. At last the 40 gallon Rheem HPWH was scrapped.
At April 2024, note new professional acclaim of this Rheem model, by highly-followed YouTube creator Matt Ferrell: https://www.youtube.com/watch?v=abGiNL9IT54
Can I know how my house measures up to standards? A resource of interest to me in learning tried better methods of house construction - - is Portland, Oregon 501 (c)(3), Earth Advantage . I look to them now.
Compare energy efficiency of my well-improved 1000 sf house, to that of a 832 sf super-well-built single-story ADU built in Portland in 2020. Consult this training video , at time 9:31:
$45 per month energy cost, per-year, scaled to 1000 sf: $649 per year. Presume that the EPS-label energy cost is the sum of electricity and natural gas costs. For my house that sum is a bit less than $1000.I hope that Earth Advantage collects and studies actual-cost data, now two years of it here. A score that has physical meaning, is interesting.
Actual Decades-Long Cost Data for Another Home, Where I Improved the Attics
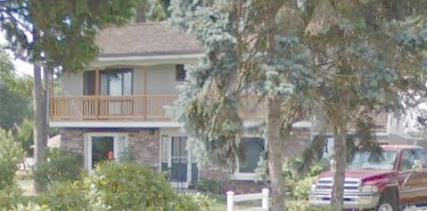
A two-story Ranch home in Sandy, Oregon:
Now begin charting for another home with extensive energy usage data, that of my older sister, whose house has also been improved by my weatherization. I look for proof that my work produced savings, and seek to learn more about what constitutes good record-keeping, and charting in MIcrosoft Excel.
This home and its natural gas usage history were described in a previous post, October 23, 2012, Making Sense of Gas Usage History . There see detail of very-substantial attic floor sealing and added insulation.
An additional decade of data is interesting. Was the Winter of 2020 exceptionally cold; or staying warmer and healthy in the epidemic? This home used more than twice as much natural gas than mine, from the same supplier, Northwest Natural, and at reduced dollars per therm. There were years before the weatherization where fewer therms were used. Were they exceptionally mild? What happened in 1997? Whatever the complexities, I think the charting is a rewarding exercise. We're doing good things. What will we see if now there is conversion to heat pump HVAC? History matters.


