Please experience as much of the job as you wish, in job photo albums. Some elements of this job have been shared in older posts, for example, discussion of soffit baffles.
At 11/4/2014, look for further discussion of this job , with charts of gas usage for a 23 year span.
Garage Attic Ladder
 Work actually began in 2008, with installation of a first MidMade attic ladder in a newly-replaced garage drywall ceiling.
 House Attic Ladder
Here I coped with replacement of a defective door limit arm. My enthusiasm for MidMade ladders was not reduced.
House Attic Prep
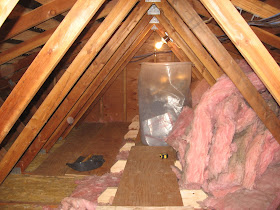
Added top-layer insulation was crumpled kraft-faced. For intimate placement, I stripped all facing. All pink batts fit in a much-more-thorough base course overflowing the tops of 2x4 truss bottom elements.
Please know this was not a best effort with flooring of a truss attic. Please find many better examples at this blog.
House Attic Baffles & Insulation
This attic is now well-ventilated, over thorough R40 insulation. Found batts generally blocked soffit vents.
This is at February 23, 2010.
Middle Attic Insulation & Decking
Here is a small attic accessible through the garage.
Crossing layers of R15 will slow large heat losses through bedroom walls.
Why would one stop at R15?
This is at March 15, 2010.
Here is an Excel chart of the natural gas usage in this home:
Do you see change starting in February, 2010? Here are monthly numbers, and annual totals July through June. I see annual savings of up to $600 per year. Maybe as little as $200. It is hard to work past variables of weather and lifestyle. We all should have the privilege of such after-job monitoring. It is a bit of work requiring ownership and modest skill, in Excel. A gas utility might send charts and tables annually in July, and/ or at the time a rebate is paid. Twelve-month average therms per day, as charted in paper bills, are not useful in seeking a bigger picture. I wish I had known to seek a six years history in 2010, to add to this time line. Many of us keep a long history of bills. This customer could readily help me look further back, with retained or logged monthly statements.
I have bothered to predict savings, and results are presented with analysis, here.
In summary:
Main Attic Insulation: $61/yr.
Main Attic Floor Sealing: $200/yr
Middle Attic Insulation: $30/ yr
Total: $291 per year, at $2 per therm gas cost. More than two thirds is from sealing that has no impact on readings of a blower door. A blower door is never the measure of effective floor sealing.
Savings from weatherization investments are reduced at subsidized, not real fuel cost, $1.15 per therm for natural gas in this home, in 2012.
There is a corresponding saving of air handling electricity cost. My own gas and electricity usage numbers suggest about $20 per month additional electricity average in the heating season, vs $35 per month for natural gas.
Natural Gas Usage Update
At October 2022, look at natural gas through another ten years since the home improvements of February, 2010. See that lowered energy usage has continued.
This busy plot of monthly gas usage over a thirty year span might be explained with reference to four stages in the life of a family of six.
Stage 1, up to 1996: still some children in the home. Indulge in a little more heat.
Stage 2, 1996 to 2005: Empty nest, conserve heat.
Stage 3, 2005 to 2010: A grand-child in the home. Up the heat. Bear the cost of rising cost of natural gas.
Stage 4, since 2010: House much more comfortable after attic weatherization capping big attic floor pits. Stable costs still less than in the 1990s despite doubled cost of natural gas. Two persons aging, keeping warm.
A look at annual totals should be more meaningful. With this, also chart annual Dollars per Therm. Conservation measures were inspired in part by doubling of the cost of natural gas through 2008. A lowering of natural gas cost since 2008 has brought complacency, in our not moving ahead with further conservation measures, as in conversion to heat pump heating/ cooling. Beyond 2022, expect big increases in fossil energy cost that will inspire the next big step for controlling energy cost in this home.


No comments:
Post a Comment